Email marketing is likely to be one of the most important marketing channels for your business, and for good reason.
- It delivers one of the highest (if not the highest) ROIs, with a reported 4,200% return on investment.
So it’s vital to keep track of your email marketing performance. After all, what you measure, grows.
To do so, that means monitoring a series of important email KPIs (Key Performance Indicators), showing how your performing in each specific area.
But which email KPIs are most important?
This post details the 7 top email KPI metrics you should be tracking (and we'll show you how to calculate each one)...
Top 7 Email KPIs
First, an important proviso...
Apple’s iOS 15 Upset the Apple Cart
Apple’s release of Mail Privacy Protection in iOS 15 in 2021 rendered some of the email KPI metrics below less useful than they were before.
Since then, people receiving emails in Apple Mail (on average, about 40% of subscribers) show as having opened the email, regardless of whether or not they did so.
It means the number of opens is no longer strictly accurate.
But...
- The metric can still be useful for comparing one email against another, in terms of the relative open rate (OR), click-through rate (CTR), and so on.
- Some email campaign services are finding workarounds and extrapolating a more accurate open rate (OR).
The email KPIs impacted by Apple's update are indicated in the relevant section below.
Now let's take a look at the top 7 email KPIs you should be tracking...
1. Click-Through Rate (CTR)
Note: this is one of the email KPI metrics affected by Apple’s iOS 15 update referred to above.
This email KPI reflects the proportion of people who have opened your email who went on to click a particular link in it.
In other words, out of everyone who opened your email, it shows you the percentage of people who clicked on a particular link.
If you have more than one link in an email (for example, a newsletter might include several links to different pieces of content), you can compare how each link performed.
Calculating the click-through rate on a per-link basis is also useful for where your emails have, say, links to social profiles, and you want to know the percentage of people who clicked on your specific CTA link(s) rather than any general links.
Note that, because of iOS 15, the calculation involves dividing by an inflated number of opens, in turn pushing down the percentage you get in the result.
So while not as accurate as it could be, the metric is still useful for comparing the effectiveness of different emails, or links within the same email.
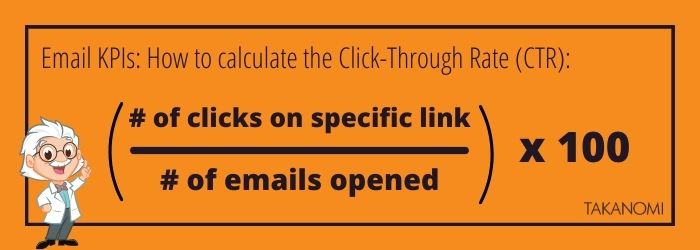
How to Calculate the Click-Through Rate (CTR)
2. Click-to-Open Rate (CTOR)
Note: this is one of the email KPI metrics affected by Apple’s iOS 15 update referred to above.
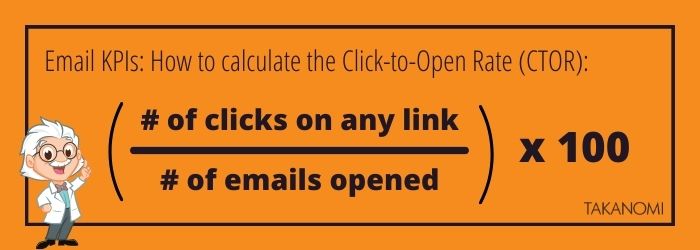
Whereas the CTR metric above is for individual links, this CTOR metric is for your email as a whole.
In other words, it answers the question:
- Out of everyone who opened your email, what percentage of people clicked on any link in that email?
The answer tells you the proportion of people who opened your email who actually then went on to click a link in your email.
However, once again since iOS 15, because the number of opens used in the calculation is no longer accurate, the percentage will be artificially lower than it otherwise should be.
As with CTR above, It’s therefore most useful for purposes of comparing results between different emails within your business.
How to Calculate Your Click-to-Open Rate (CTOR)
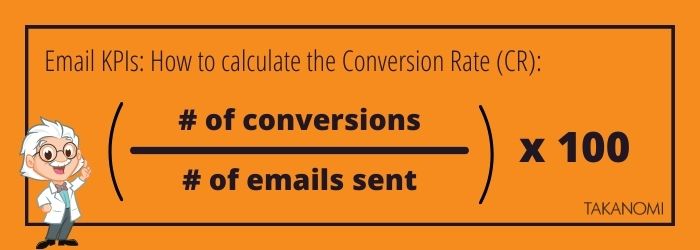
3. Conversion Rate (CR)
Let’s say you’re sending out an email with a specific goal in mind, such as to sell a particular product as part of a promotion you’re running.
Your conversion rate tells you the percentage of people, out of everyone you sent the email to, who took the required action.
You will need to be able to measure the number of people who specifically converted as a result of your email—such as by clicking on a particular link in the email—rather than everyone else who took the same action.
You may also be running ads on Facebook that advertise the same deal—you don’t want any conversions from that included in your calculation for your email CR.
How to Calculate the Conversion Rate (CR)
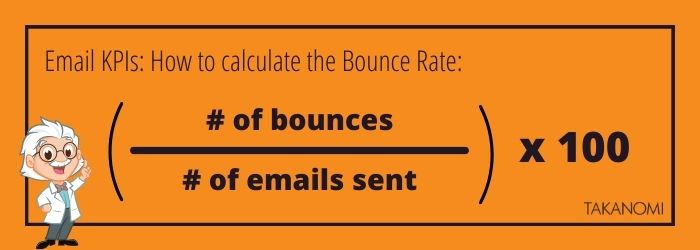
4. Bounce Rate
The bounce rate tells you the percentage of emails that never made it to subscribers’ inboxes.
The reasons include:
Email addresses that cause hard bounces should be removed from your list.
Some email campaign providers take care of this automatically, ensuring that no further emails will be sent to the person (while keeping the contact itself intact, as there may be other data that’s still valuable such as a physical mailing address).
For soft bounces, these emails are usually kept on your list. Some email campaign providers will:
- Track the number of soft bounces and treat them as hard bounces after a certain amount.
- Automatically attempt to redeliver the message a certain number of times.
This email KPI is important to keep track of because the metric, if too high, can impact the deliverability of emails to the rest of your list.
It’s generally recommended to keep it less than 2%—if it creeps higher, take action to reduce it by for example:
- Deleting hard bounce email addresses from your list, or otherwise ensuring delivery won’t be attempted
- Doing similar with soft bounce email addresses where the issue remains unresolved after a certain of sends or over a particular time period
- Using double opt-in for new leads to avoid corrupted or dummy email addresses that immediately hard bounce.
How to Calculate Your Bounce Rate
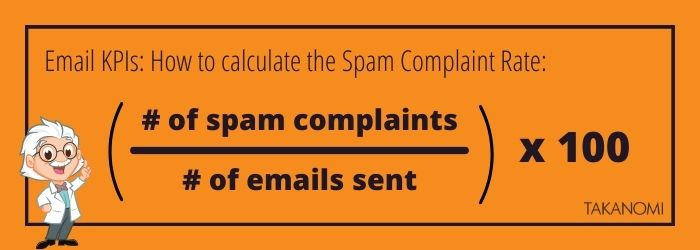
5. Spam Complaint Rate
As with your bounce rate, the number of spam complaints you get affects the deliverability of emails to your list as a whole.
If too many people are reporting your email as spam, it’s a red flag for services like Gmail who are more likely to then send your emails straight to the spam folder for other recipients.

While a certain proportion of people will always mark an email as spam even when it’s no such thing, if the number starts to creep up or gets above a certain level, it indicates potential problems:
To fix, reduce the possibility of future spam complaints by doing one or more of the following:
- Use double opt-in to ensure leads have to confirm that they want to hear from you before receiving messages
- Be very clear about how people can unsubscribe—it’s good practice to tell them how to do this in the first email they receive. It’s far better for someone to click an easily accessible unsubscribe link than to mark the email as spam
- Ensure people don’t have to jump through hoops after clicking the unsubscribe link to actually leave your list—it should be an easy, virtually instantaneous process
- Be clear right from the start about the type of messages you will be sending them
- Be consistent in your communications so that the expectations of your leads are set. If you’ve been emailing them once a month, and suddenly switch to once a day, spam complaints are likely to rise simply because it’s not what your leads are used to.
How to Calculate Your Spam Complaints
While you can check spam complaint rates for specific emails, it’s often more useful to measure your spam complaint rate for a specific time period, such as for a month.
The calculation is simple:
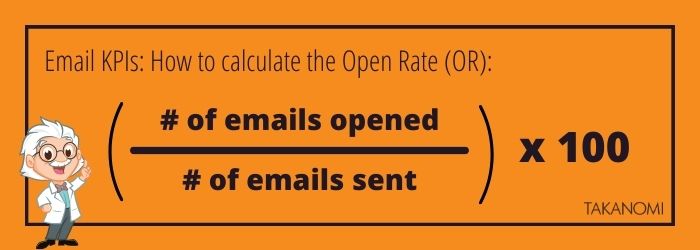
6. Open Rate (OR)
Note: this is one of the email KPI metrics affected by Apple’s iOS 15 update referred to above.
As detailed at the top of this post, since Apple’s release of iOS 15, the open rate (OR) is no longer accurate.
That’s because anyone on your list who uses Apple Mail (around 40%] will have the email counted as ‘opened’, even when they may not have opened in.
However, the metric is still useful as you’re able to compare one email against another. In other words, it’s a measure of relative performance.
And while there’s an argument that your open rate is largely a vanity metric—after all, email opens don’t necessarily translate into real engagement—it does have an impact on email deliverability.
It’s therefore important to know how your emails perform against each other and work to maximize that performance.

How to Calculate Your Open Rate (OR)
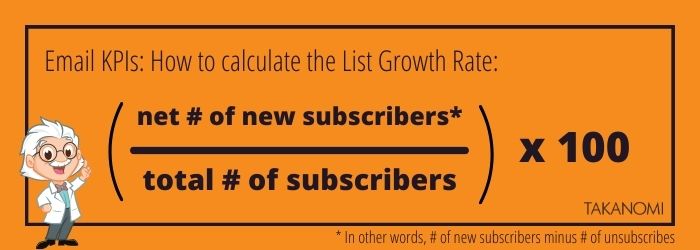
7. List Growth Rate
Of course, you want to know whether your list is growing—or perhaps shrinking—and the rate at which it’s doing so.
You may have a specific KPI you want to hit or exceed each month in relation to the growth of your list to help ensure the continued growth of your business as a whole.
Keeping an eye on this email KPI metric means you can see when your strategies are working, and maybe when you need to ramp things up a bit.
How to Calculate Your List Growth Rate
Frequently Asked Questions
How can I calculate the Click-Through Rate (CTR) for my emails?
Divide the number of clicks on a specific link by the number of emails opened.
What does the Bounce Rate email KPI measure?
It indicates the percentage of emails that failed to reach subscribers' inboxes.
Why is it important to monitor the Spam Complaint Rate in email marketing?
High spam complaints can impact email deliverability and subscriber engagement.
How should I calculate the Conversion Rate (CR) for my email campaigns?
Divide the number of conversions by the number of emails sent, then multiply by 100.
What is the purpose of tracking the List Growth Rate in email marketing?
It helps monitor the growth or decline of your email list, indicating the effectiveness of your acquisition strategies.
To Conclude
So that’s 7 top email KPIs to calculate and keep track of so you know exactly how your email marketing is performing.
One way to keep a regular track of them is to set up a spreadsheet with a tab for each one, with relevant formulae that automate the calculations.